
07 - Measurements & Quantification#
Lesson Overview#
In this lesson, we will begin by introducing the limitations of optical microscopy in image analysis. Then, we will explore how to practically measure and quantify data from images using Python.
Limitations of Optical Microscopy on Image Analysis#
Slides#
Introduction to Measurements and Quantification#
In this section, we will learn how to use Python to measure and quantify data from images. In other words: how to go from images to numbers to plots. This process is often referred to as feature extraction. Feature extraction is the process of computing quantitative descriptors from image data that help capture relevant patterns, structures, or biological signals. In the context of microscopy, these features represent properties of cells, tissues, organelles, or other biological structures. Feature extraction bridges raw image data with biological insight, enabling classification, clustering, and statistical analysis.
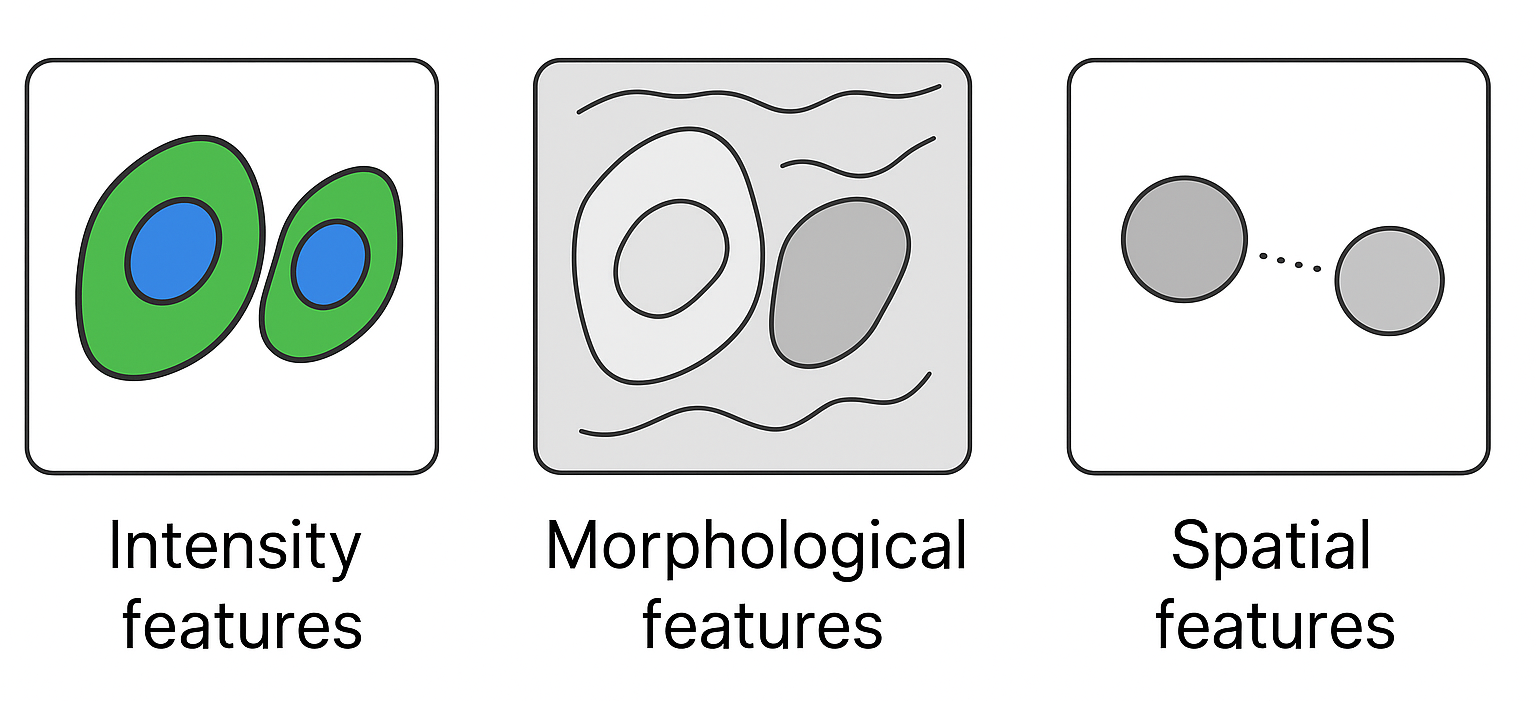
There are three broad types of features typically extracted:
Intensity features: Related to the pixel brightness distribution
Morphological features: Describes shape and size
Spatial features: Captures location and relationship between structures
Intensity Features#
Intensity features summarize the distribution of grayscale or fluorescence intensity values within an object or a region of interest(ROI). These features are sensitive to signal strength and can reflect biological activity such as protein expression, DNA content, or mitochondrial potential. Examples include:
Mean Intensity: The average pixel intensity within the object
Median Intensity: The middle value in a sorted intensity distribution
Standard Deviation: The spread of intensity values around the mean
Histogram: Distribution of intensity values
Integrated Fluorescence Intensity: Sum of all pixel intensities in the object
Fluorescence Intensity Ratio: Ratio of two different channels
Morphological Features#
Morphological features describe the shape and size of an object. They are computed on segmented ROIs, such as individual nuclei or cells, or even tissues. Examples include:
Area: The number of pixels within the object
Perimeter: The length of the object’s boundary
Circularity: The ratio of the object’s perimeter to its area
Spatial Features#
Spatial features capture the location and relationship between structures. They are computed on segmented ROIs, such as individual nuclei or cells, or even tissues. Examples include:
Centroid: The center of mass of the object
Distance to Nearest Neighbor: The distance to the nearest neighbor object
Convex Hull: The smallest convex polygon that encloses the object